Environmental-Economic Accounts
Stats NZ
An illustrated infographic that combines a whole-context view with comparative data visualisation.
Expertise
- Infographic design
- Illustration
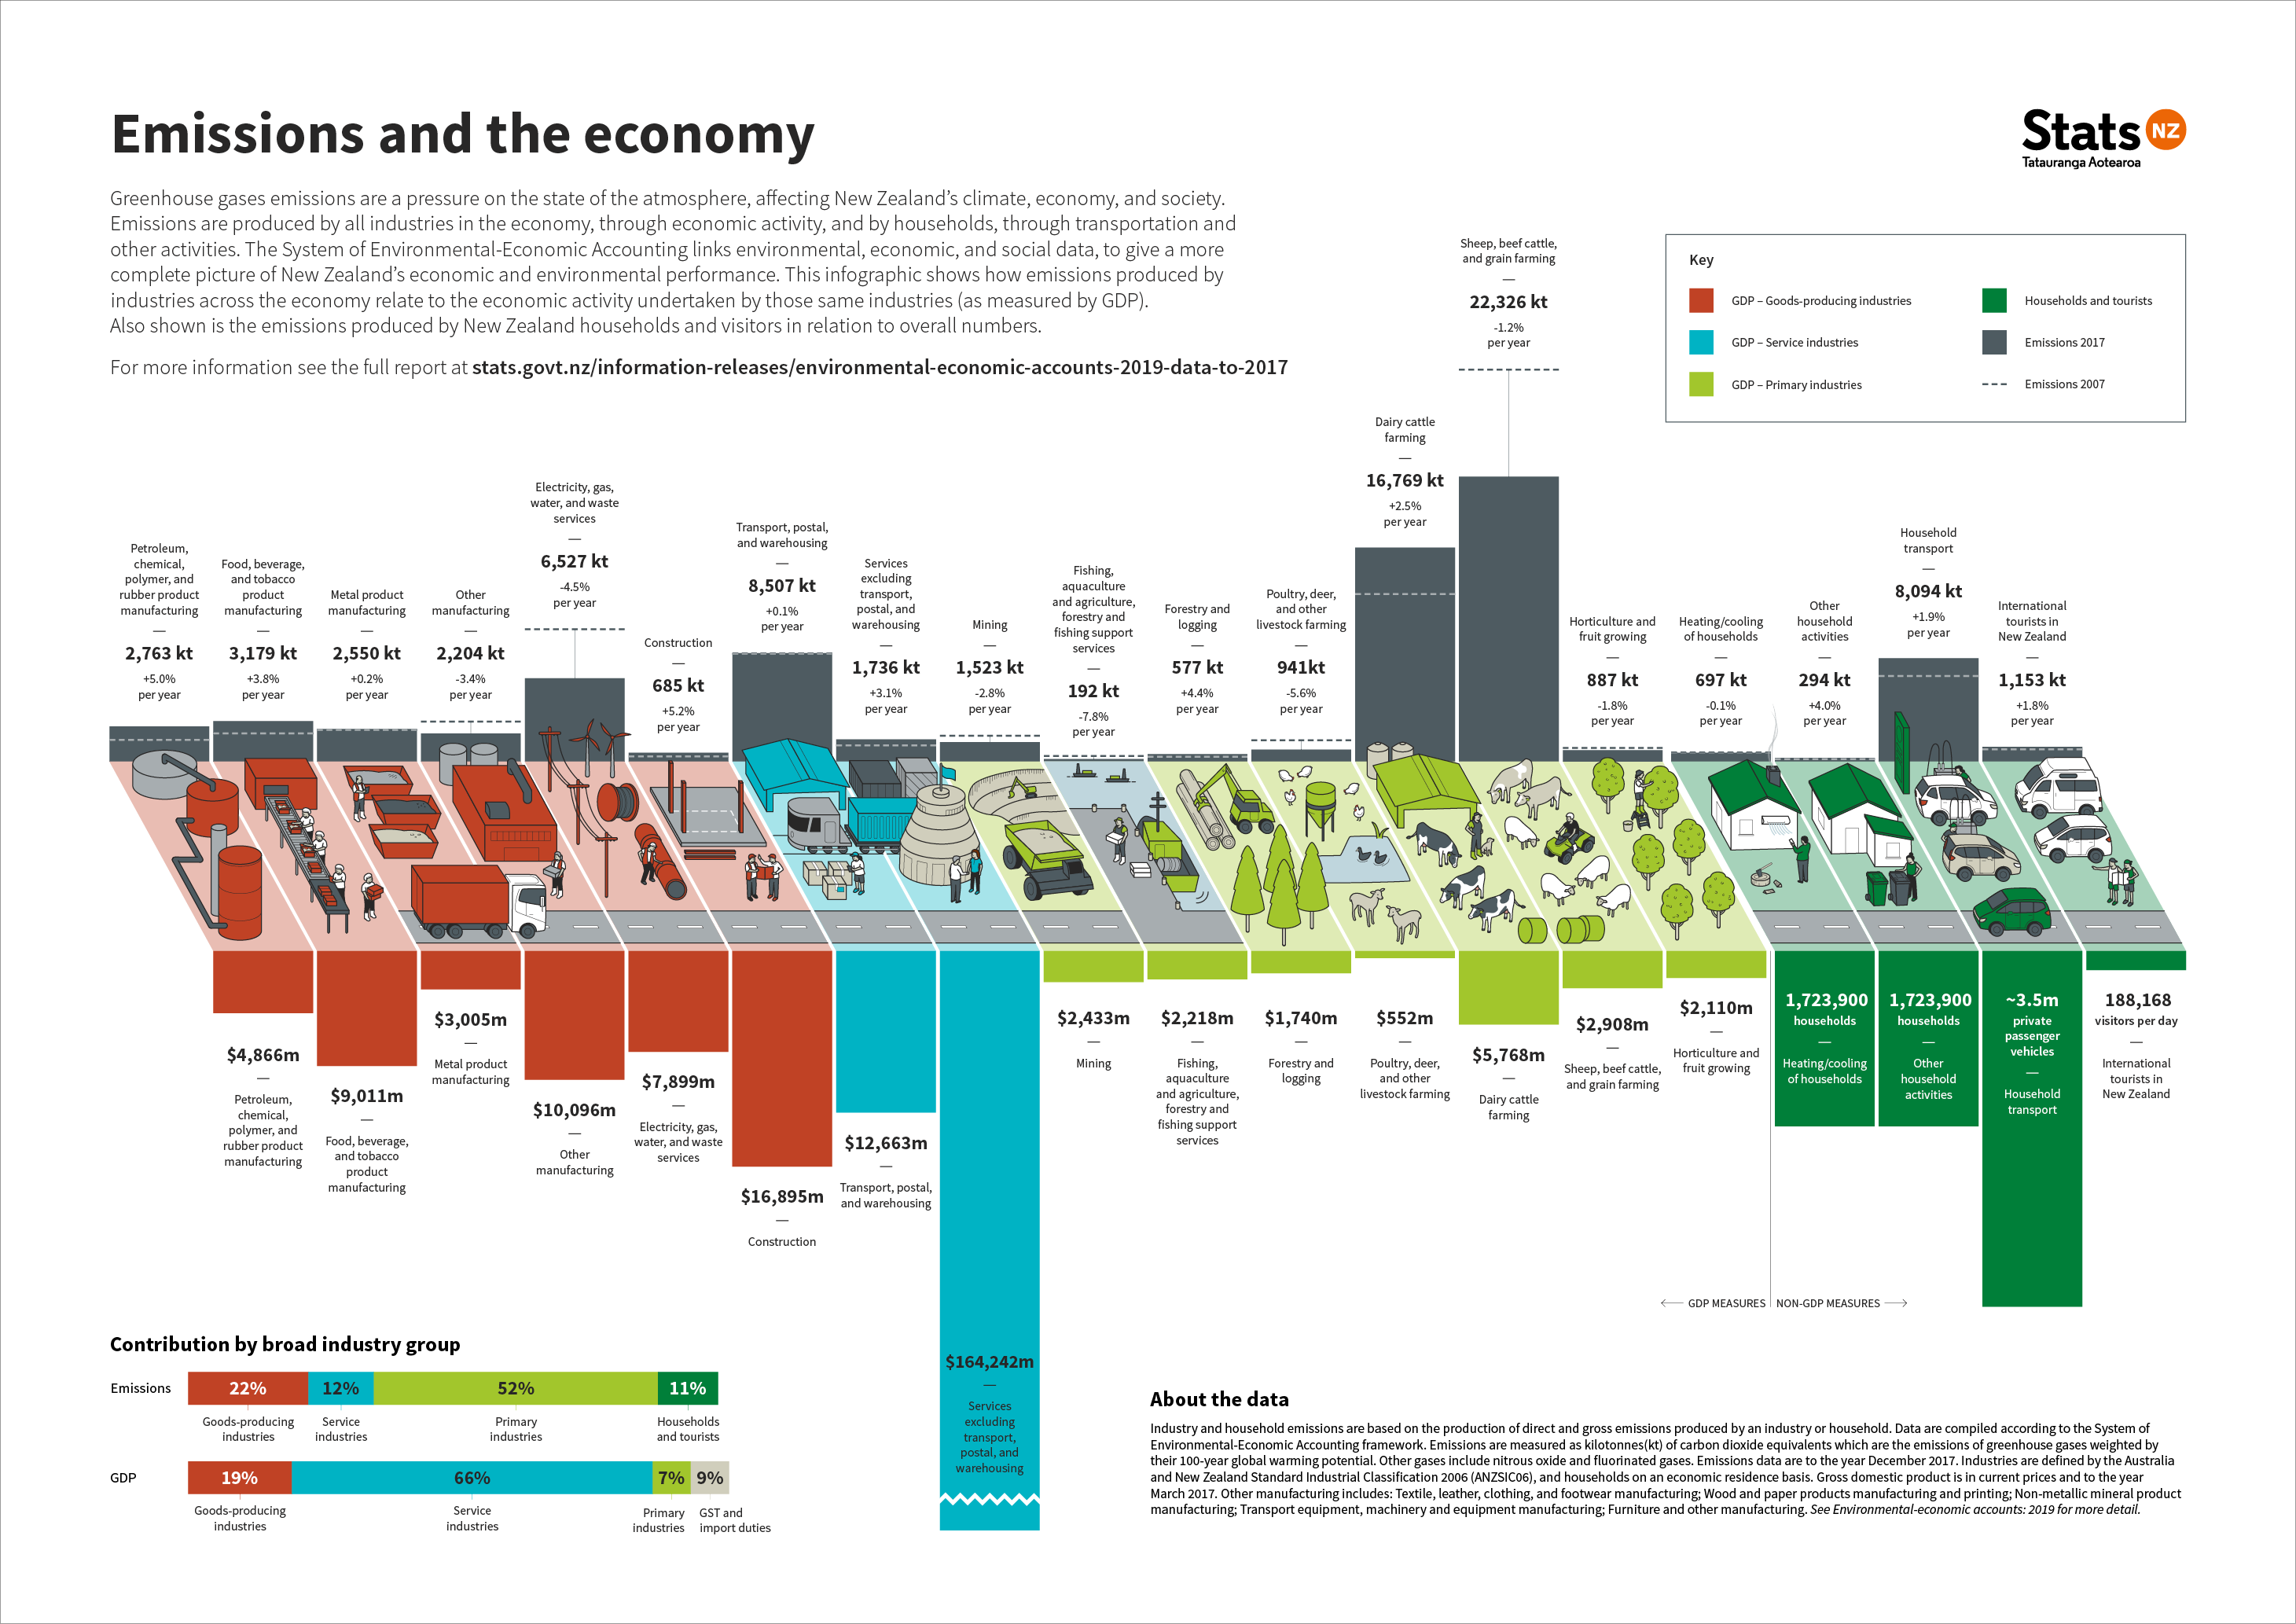
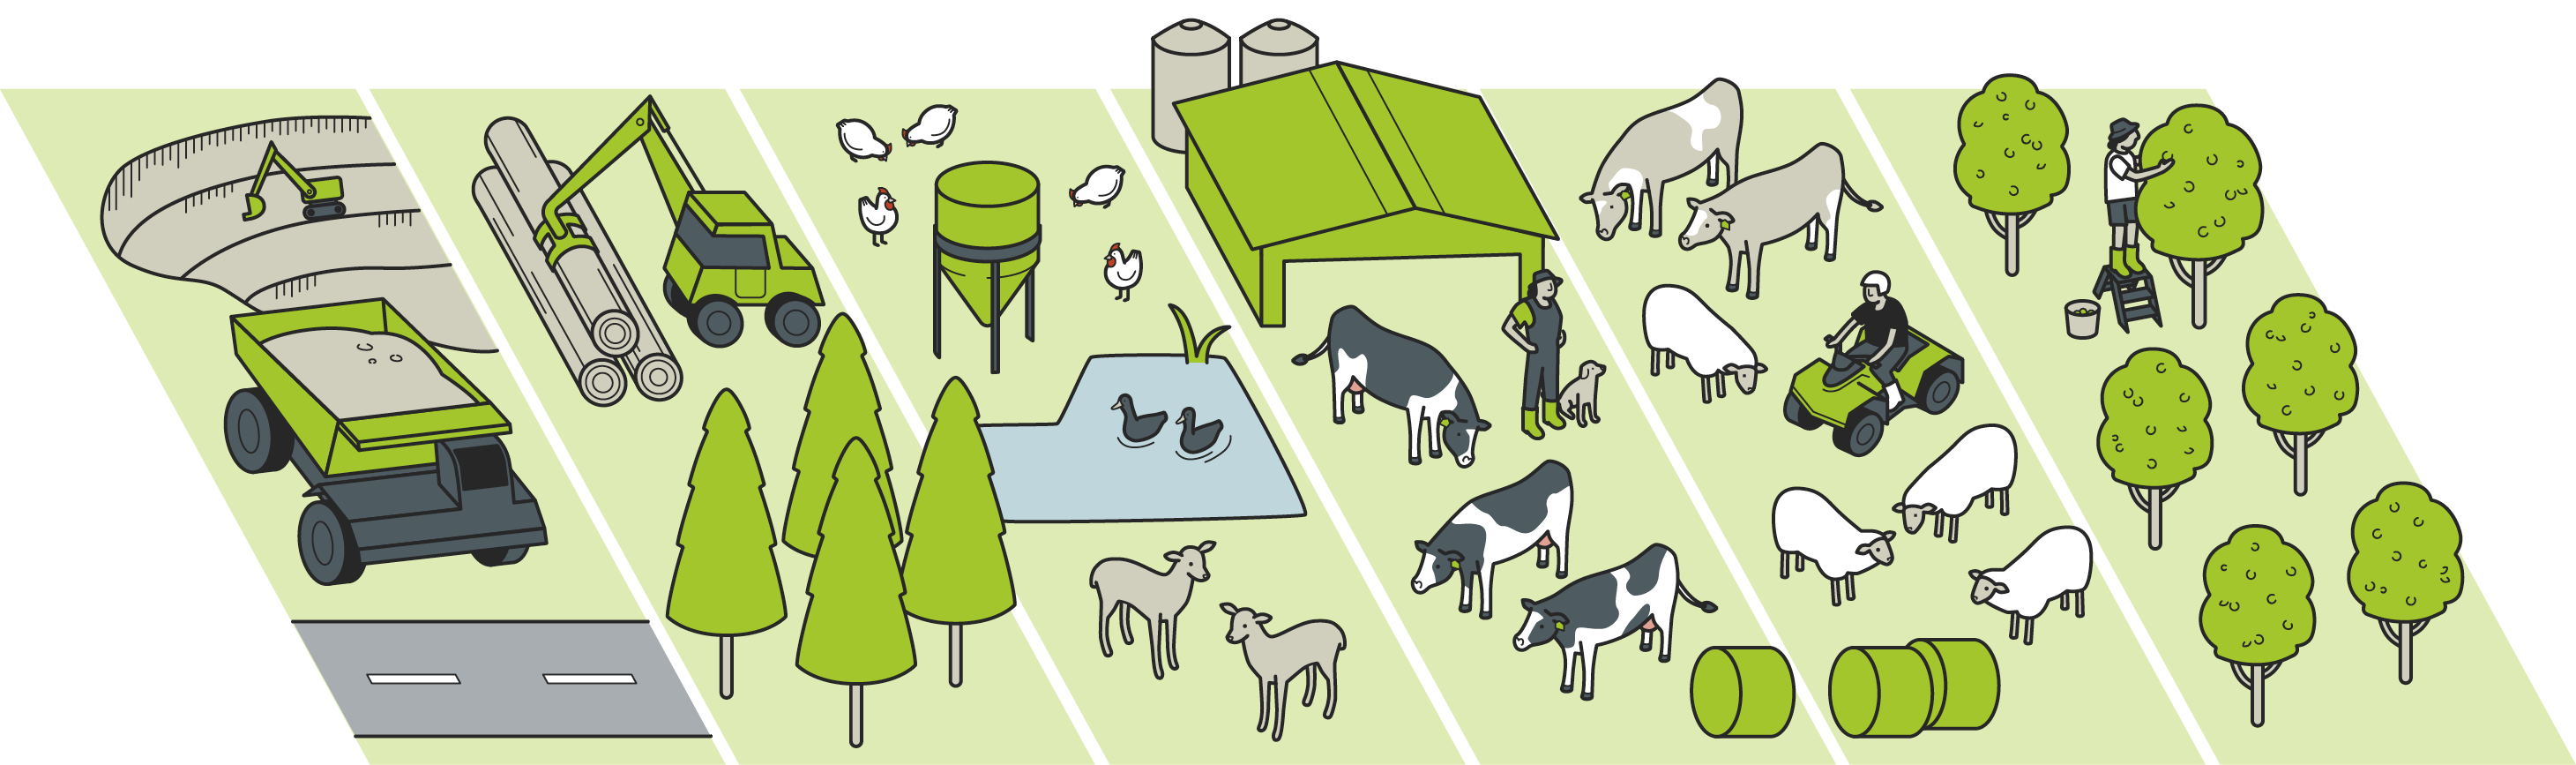
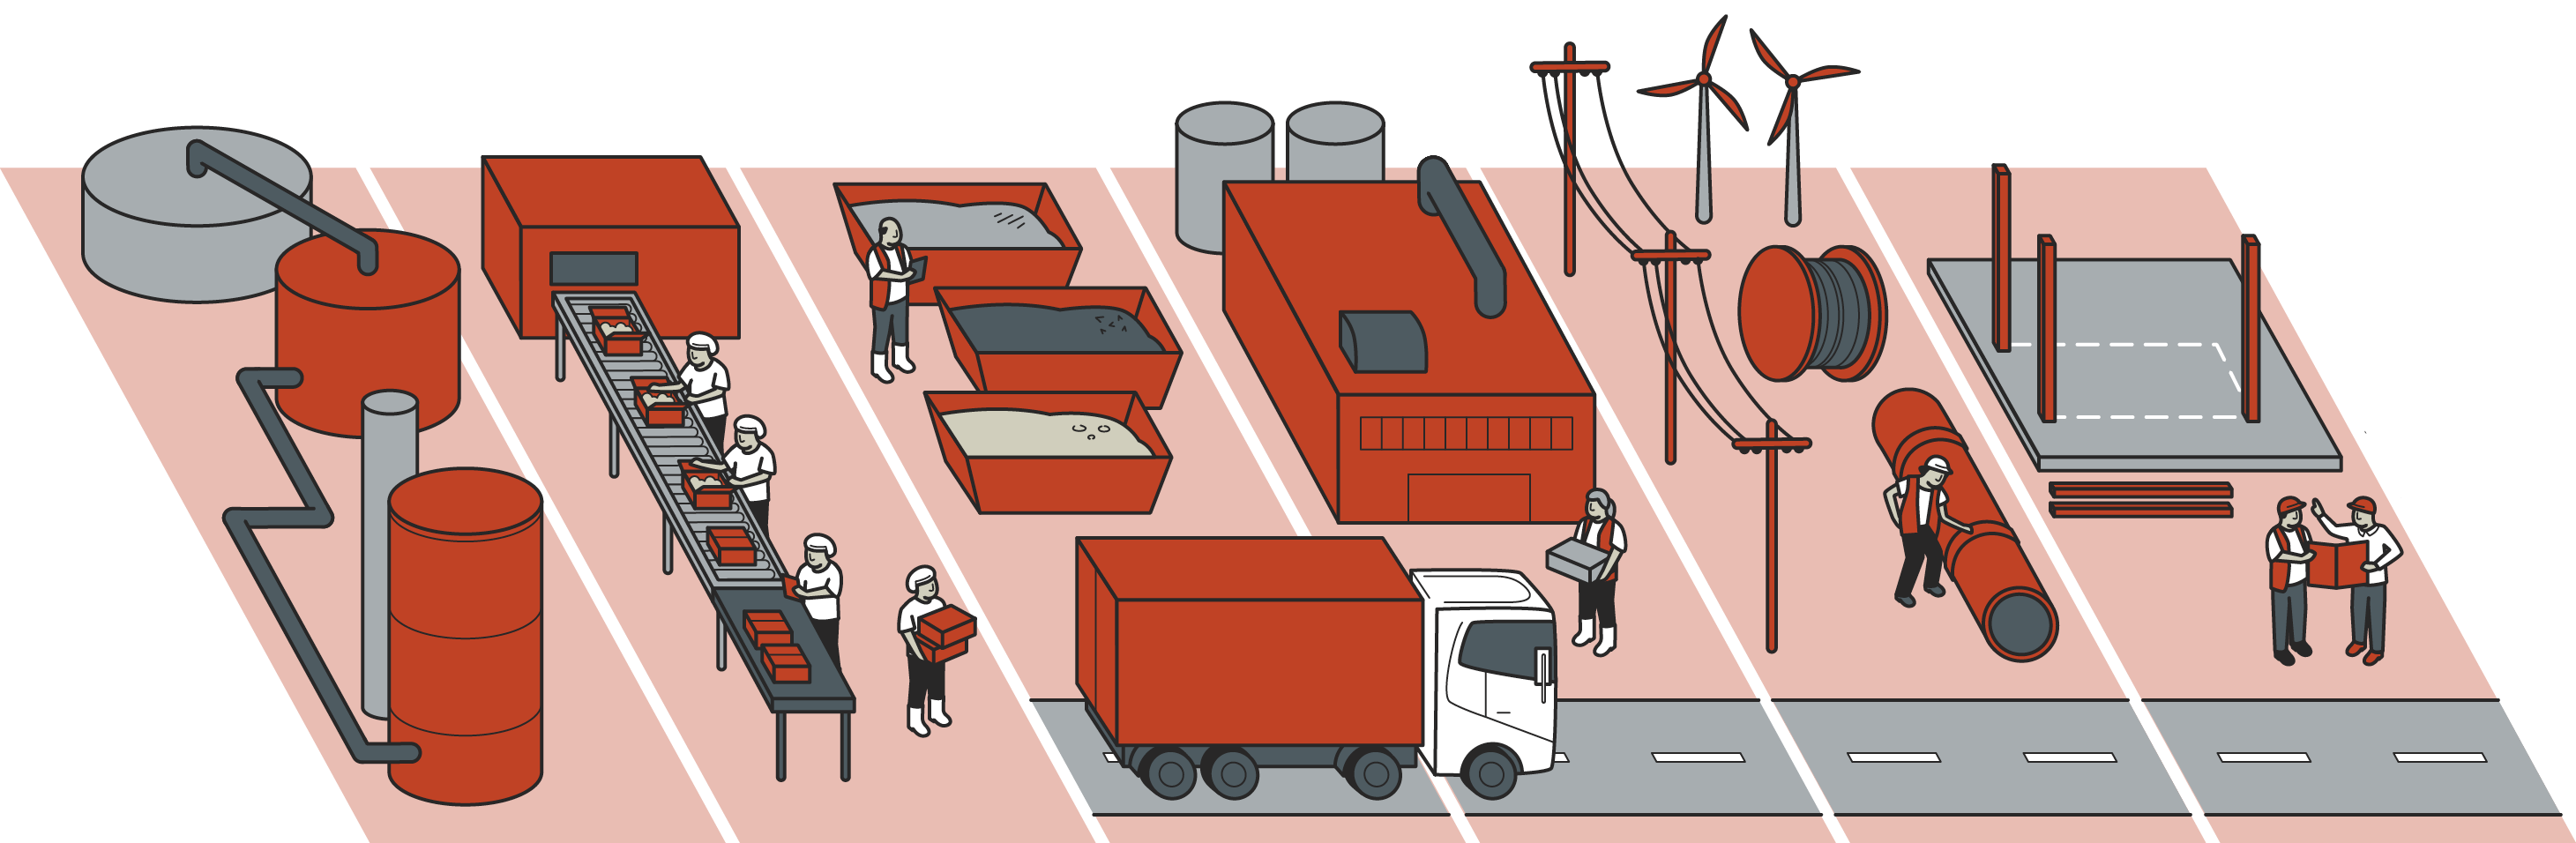
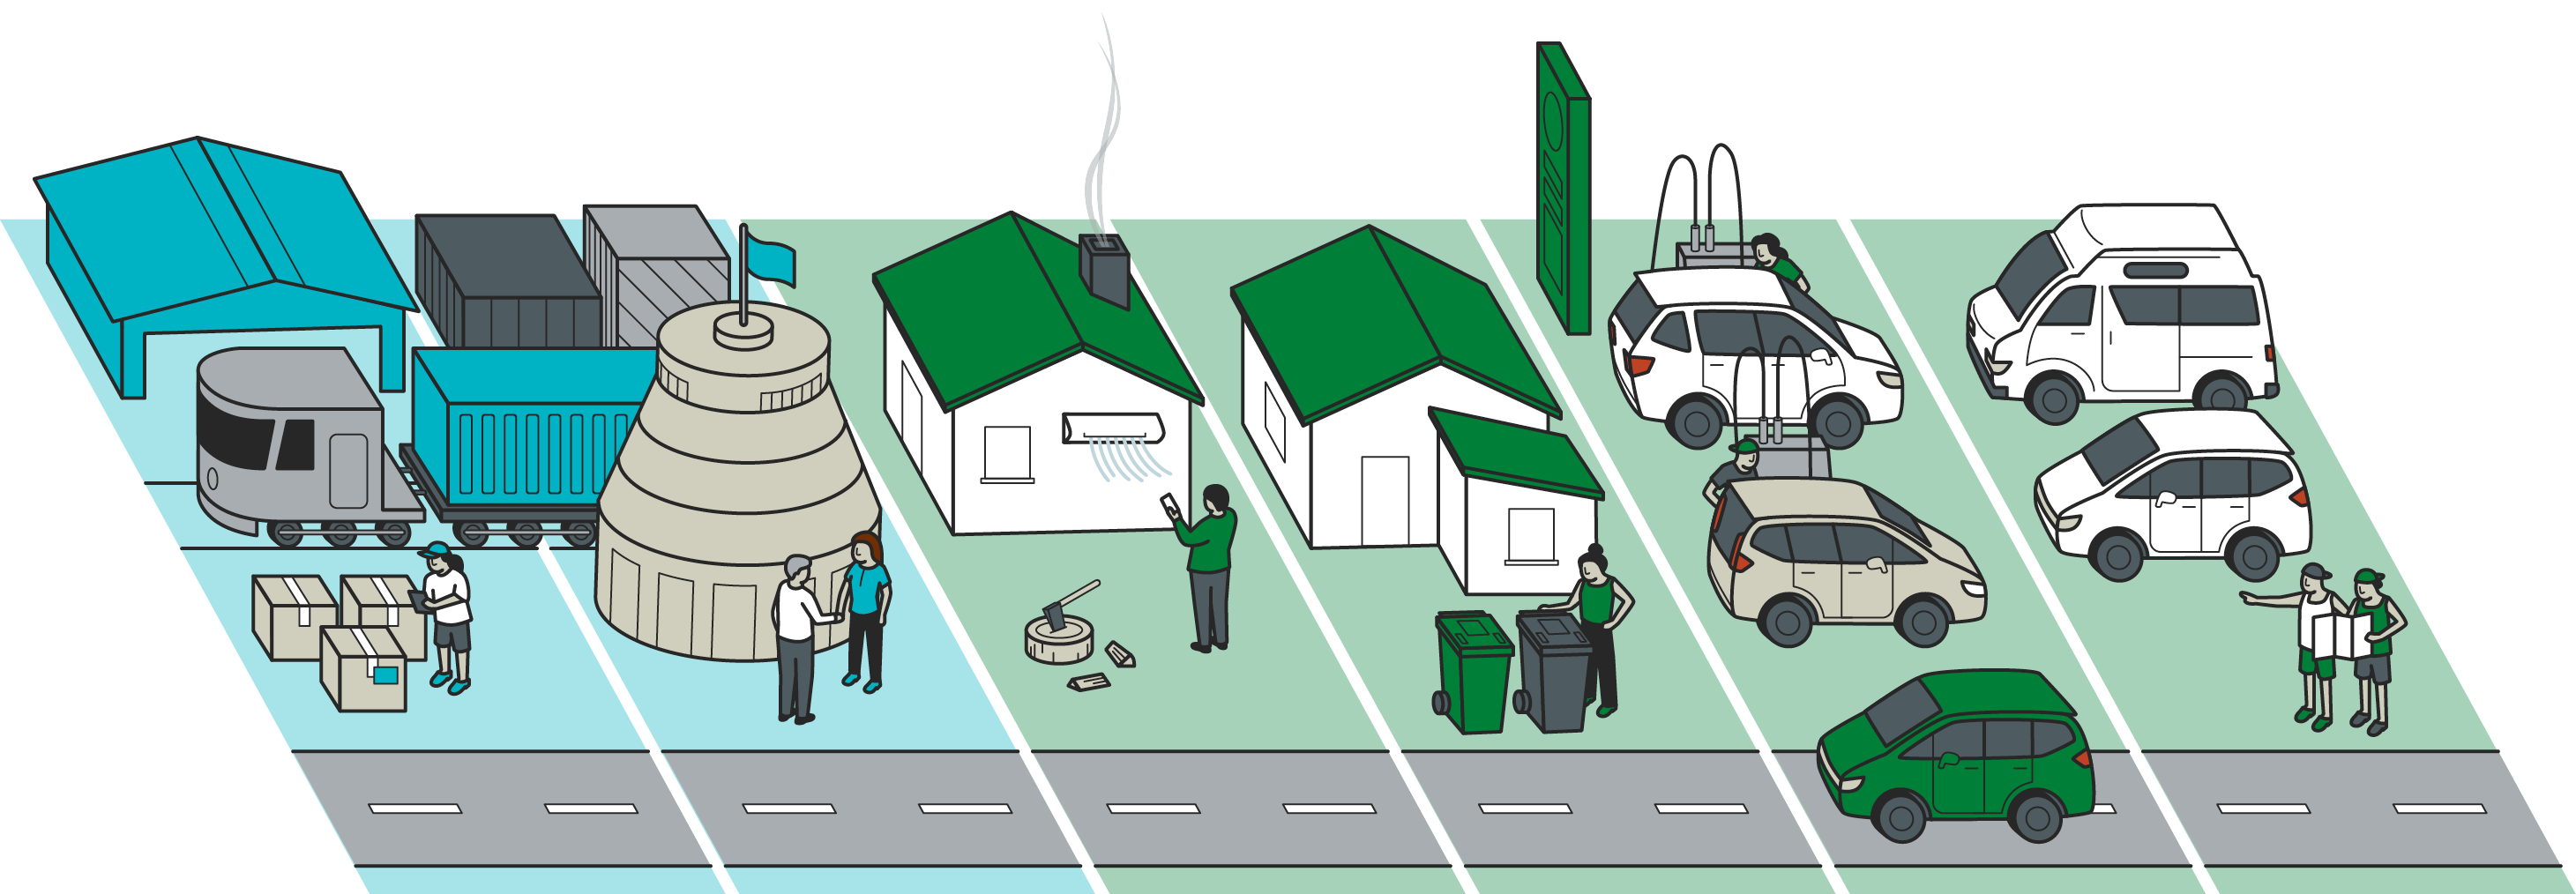
The infographic combines data visualisation with illustration, resulting in a graphic that strikes a balance between the environment and the economy. The illustrations bring each industry to life, depicting the context and drivers of emissions in each area.
Keen to chat?
Get in touch with our team or have a look at our work to see if we’d be a good fit.